
Regardless of what may be going on at the Fed or Geopolitically, I am focussing a lot of my research on whether or not the US debt ceiling will be lifted, suspended, or scrapped. The current level of the US Statutory Debt Limit is $31,381,463 and the current Total Debt Subject To Limit is all the way up to $31,381,438 (All numbers rounded in millions).
Debt Ceiling Must Be Raised, Jerome Powell Argues Again
US could face default as soon as June if debt ceiling isn’t lifted, says thinktank
US could default this summer unless $31.4tn debt ceiling is raised, CBO warns
These kinds of headlines sell editorial pages, and the whole scenario is just a game of politics. There are many countries with debt, but none treat it this way as the US does.
Interest rates are also still at the front of every trader's mind and the news is also full of headlines about inversions and rate hikes. Soft, Hard, and No landings for the economy are supposedly dependent on the Fed's actions. It would help if every one of them could agree on what the output of, increased rate hike inputs was, but they can't, so we're left with confusion and turmoil.

Rates
Raising rates is supposed to curb rising inflation. But the evidence would suggest that raising the cost of credit lifts the price of all goods and services, increasing said inflation. Raising rates is supposed to curb consumption and if we all bought less, prices would come down. The problem for the Fed is that analysts like Peter Zeihan who looks at real-world problems rather than financial myopic problems say there will be supply shortages coming, as Germany and China lose manufacturing output capabilities. Farming will also lose the yield from crops, meaning food inflation will rise, all combined with the cost of stuff made primarily in Europe and China going up. It will take 5-years for the MAGA pushed by President Biden to work, as the US re-tools and sets up new manufacturing bases.

Looking forward to 3 weeks' time, the market is expecting the Fed to raise rates by 25bps again. Though the 50bps crew is stepping up with a 25% probability of that happening (currently). The Fed FOMC usually does what the CME says, so I think we just ditch the FOMC!
We've seen nearly 500bps of rate hikes in this cycle and this has resulted in a lot of things rising in price and quantity, some exponentially.


The charts above show that as the Fed EFFR rises the Fed has to make interest payments on the reserves held there. We're nearing $1 trillion of interest payments!
Interest rates are also used to predict what may happen in the future, so we see a lot of talk about the inversions currently seen in the spreads.

Yield curves that rise from the lower left to the top right of the chart are said to be healthy, as the longer you hold debt, the more you would like to be paid for locking up your cash.

We're coming up to 12 months of the treasury curve being inverted

But the eurodollar yield has been inverted in places along the curve since December 2021. After the latest US inflation data, there was a push higher at the front months, and we're also seeing the tail of the curve rising slightly.
For anyone following along with the 2-10 UST curve, the recession usually hits as that curve starts to accelerate higher, not as it goes lower. So if you follow Mr. El-Erian you can ignore his posts until he says things are normalizing.

Looking at the curves that the Fed probably does have some effect on, we can see that the Fitted Inst. Fwd 2 years, is below the Market Yield 2 years, which has in the past signaled time for the EFFR to be lowered. CME Fedwatch tool isn't predicting that this month, so it will be interesting to see when they do.

One reason why the Fed is unlikely to hold or drop rates this month is the uptick in PCE inflation that bucked a couple of prints trend. As I said, raising rates and high energy prices are going to cause inflation!

Real rates would appear to be really positive now, so adding another 25bps to 50bps is going to actually keep giving the wealthiest people more money. The stimulus for the rich.
Fiscal Flows
Moving on to the flows, deficit spending, and debt boom. From today's Andreas Stenolarsen substack:
3 charts that will wrongfoot all the bears
The boost to consumption in January has been a puzzle to many, but it actually makes sense if we look at some of the underlying technical drivers of consumption. Bracket thresholds for federal personal income taxation levels have been increased markedly (due to inflation) in the US, meaning that the overall nominal taxation has been lowered markedly.
This has released around 250bn USDs worth of spending power annually from the get-go of 2023. Wages will eventually like play “catch up” to new taxation thresholds, but it is undoubtedly a short-term booster to consumption.

The yearly “COLA” inflation adjustment to social security benefits will add another 100bn to spending power after an 8.7% adjustment in January. This will be paid out to people with a high propensity to spend, why this arguably is another booster to short-term consumption in the US.
Tax reductions paired with inflation adjustments to benefits have in total added around 350bn to the spending power on an annualized basis in January, which translated to an increase in personal disposable income of 2.5-3% in the US.
The consumer is back, and it will be felt in numbers this spring.

My version of what Andreas is talking about is the deficit spending chart above. This time last year we had peaked at $244.5 billion in deficit spending. This year we touched $300 billion. The flows have been accelerating and the reasons given by Andreas are definitely part of it. Social Security is a good one, along with Medicare, Medicaid, Pensions, and War. President Bidens infrastructure bill that past is pushing money into the economy now. https://www.whitehouse.gov/build/maps-of-progress/ If the administration had got the Build Back Better bill in its entirety GDP would be nearer 8%.

With one day of data to go the spending for February was over $ 600 billion, something not seen since April 2022. If we were to get that level of spending for the next 6 months, we'd be on for around $ 7 trillion of spending for the fiscal year. Pre Trump the annual spending budget was at max $4.6 trillion. The more Boomers retire and start tapping up Social Security, the longer the US supports Ukraine against Russia, and the higher the spending will be. The cherry on the cake is the $1 trillion of interest payments from the Fed to the US Treasury.

Being at the debt ceiling means the Treasury General Account is being drained to keep things afloat, but it has quite a way to go before we need to be concerned about it. June is the cut-off for Janet Yellen.
Before we worry about US government defaults, people are looking at the personal consumption data and seeing that consumer credit is rising. Currently, the payments are manageable. But for how long?

The chart above demonstrates a positive correlation between the EFFR and the rise in Credit Card and Revolving loans, which subsequently leads to an increase in interest payments. While the rising interest rates may cause concern, it is worth noting that banks' willingness to lend indicates a level of confidence in the overall economy. Factors such as employment and wage data play a significant role in banks' lending decisions. Therefore, any decision to pause or pivot by the Fed may take several months before it has a noticeable impact on credit card and other debt levels.

With inventory data showing a build and consumer spending dropping, we are starting to see the Commercial and Industrial loans rollover. But we're clearly not in a downtrend yet. If you were to draw a mean line through the data, we're probably around the right levels for a continuation of a trend higher.
GDP

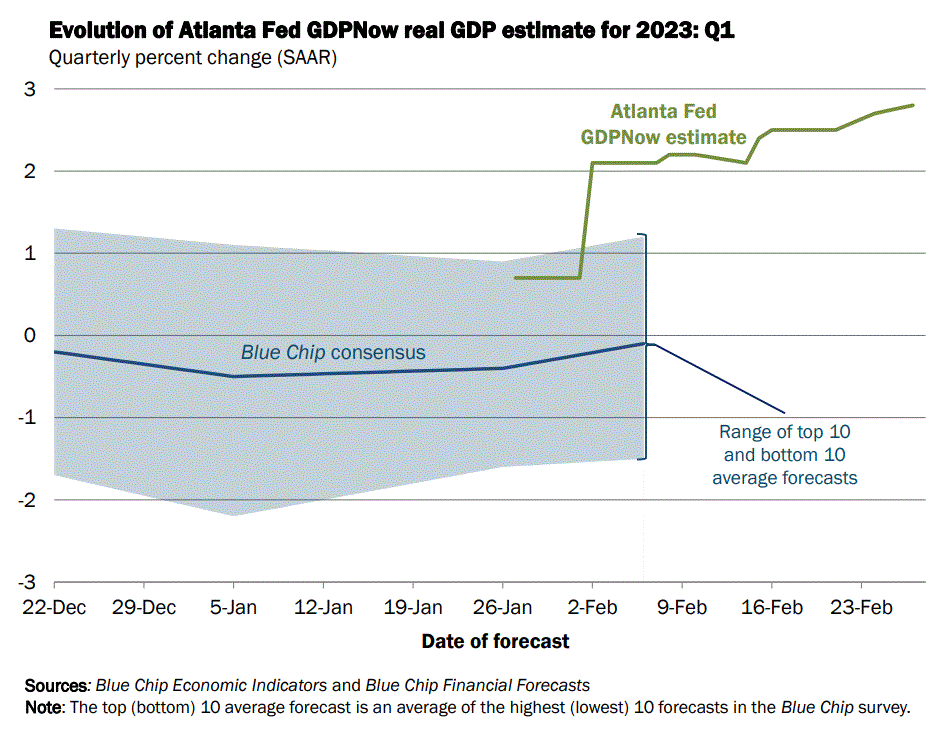
Spending is helping to keep GDP in the US positive, and the reduction in taxes so far this year is also key. Inflation is moderating as energy prices are stabilizing, especially with WTI below $80 per barrel. We had a wider trade deficit in the US in January, so just waiting to see if that is reduced for February. If it does, we should expect GDP to be stable and positive. i.e. No US recession! (for now)
Employment


To summarise the US employment situation, I see no cause for concern that millions of people are losing their jobs and claiming benefits. Which means we're not currently in a silent economic dip. People are being productive. They are making money and spending it back into the economy. Maybe not through the shops but in other ways, we all have to spend money.
Sentiment

Fundamentally I see no real reason to be short the SPX, or S&P500 index. And if you use the AAII sentiment index as a contrarian indicator as I do, we should be looking for reasons to get long.

Over 50% of the companies within the S&P500 are currently trading above their daily 200 moving average. This is a very good signal for the bulls. The only bit of concern is the pullback from the start of February.


Twitter is full of people looking at moving averages and trendlines, trying to decipher whether the SPX goes up or down. On this logic, I would have to concede that TA is bullshit. However, I do use TA in my strategies currently, so if it is BS, make it your own BS and don't follow anyone else's.

What really matters is whether these 500 companies are going to make profits in the coming year. With the amount of money flying around from the US government I am saying yes, these 500 companies as a whole will make more money this year.
Trades

My current position with regards to the end-of-day strategy is that I am not long, but I am not bearish either. With an increase in deficit spending, I am not going short. But I did have to cover my long for a small gain.

If I ditched the TA completely and just went along with deficit or surplus figures as a trigger to get long or short using the signals from 2022 to the present day these would have been the trade results
trade 1 Short 01/2022 to 02/2022 = -2.02%
trade 2 Long 02/2022 to 04/2022 = -3.54%
trade 3 Short 04/2022 to 05/2022 = 9.75%
trade 4 Long 05/2022 to 09/2022 = -2.78%
trade 5 Short 09/2022 to 10/2022 = 2.72%
trafe 6 Long 1 0/2022 to Present Day = 4.92%
Total = +9.05%